chi square test statistic
Tuesday, November 18th, 2014
The Chi square compares the observed data with the Null Hypothesis.
Chi square test looks at single set of data and Null Hypothesis.
- Ho The no difference or no association hypothesis that shows no difference between observed and expected data.
- H1 This postulates that there is a difference between observed and experimental data.
Expected = row X col total / grand total
χ2 = sum ((observed – expected) /Expected)2
χ2 and DF/degree of freedom gives the test statistic
A big difference between observed and expected results in a large test statistic (χ2) and so leads to a rejection of the Null Hypothesis (Ho)
The greater the value of the test statistic, the greater the evidence against the Null hypothesis -leads to a smaller p -value
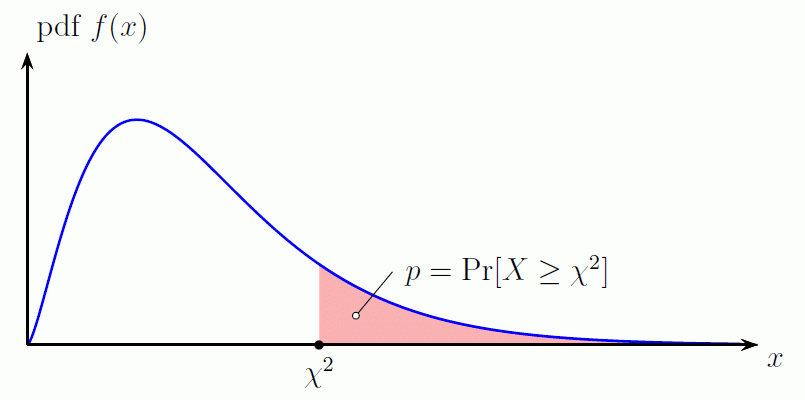
“…The p-value is the area under the chi-square probability density function (pdf) curve to the right of the specified χ2 value…” http://www.di-mgt.com.au/chisquare-calculator.h

Source: di mgt.com.au
p value is the area to the right of the test statistic. The less the number (< 0.05) the more likely to reject the Null Hypothesis
http://www.stat.ucla.edu/~kcli/stat13/stat13-lecture14.pdf
Nice video explaining it all.
Recent Posts
- Two sample t-test
- paired t test
- One sample t test
- chi square test statistic
- Derivation of the linear least squares
Recent Comments
- on Connecting to Google Analytics – Brighton PHP October 2013
- on udacity Introduction to statistics
- on udacity Introduction to statistics
- on jasonbailey.net is up
- on jasonbailey.net is up
Leave a Reply